Simple PurpleAir integration for Home Assistant
With much of the western United States on fire, and blankets of smoke spanning much of the distance to the the midwest, I wanted to be able to integrate data from the PurpleAir free air quality platform. Inspired by @colohan's PurpleAir Air Quality Sensor using the REST platform I dug a little deeper and definitely went overboard with my solution.
While the solution linked above works well, I wanted a solution that could work with multiple sensors and show up as a native air quality sensor in Home Assistant. After getting started with the base, I was able to accomplish all of my initial goals and managed to even release it to the public as well. It may or may not work with HACS, as I don't use it. You can find the repository on GitLab. It's released under the MIT license so feel free to do whatever with it.
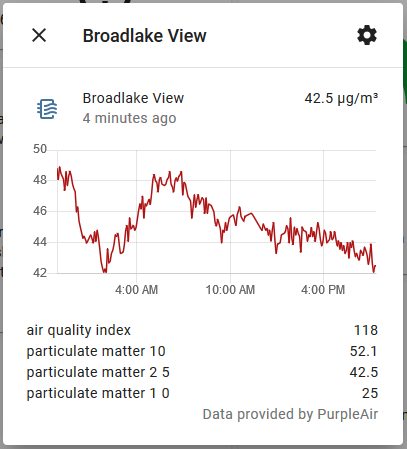
The new integration only supports setup via the GUI, and by copying a sensor JSON url during setup. It's basic as heck, but it gets the job done. Once initialized, you will have an air quality sensor, providing the PM1.0, PM2.5, and PM10 data, plus a calculated US EPA Air Quality Index (AQI) value for PM2.5. Note that while Home Assistant actually supports PM0.1 data, PurpleAir only goes to 0.3, and only gives you a raw count at that, rather than calculating the µg/m³ value. I didn't feel comfortable attempting to calculate that with the data at hand and having people rely on it. Additionally, as well as giving you an air quality sensor, a generic sensor is also provided, surfacing the calculated AQI data itself, allowing for ease of use with any automations or dropping it on your dashboard.
Installation & Setup
Installation is as straightforward as it can be, simply download the
source, and extract the purpleair directory in your
<config>/custom_components directory (where <config> is the
directory that contains your configuration.yaml file. Restart Home
Assistant to get it to pick it up, and add the integration via the GUI.
Adding the sensor couldn't be easier (well, it could be, but this was a one-day project)!
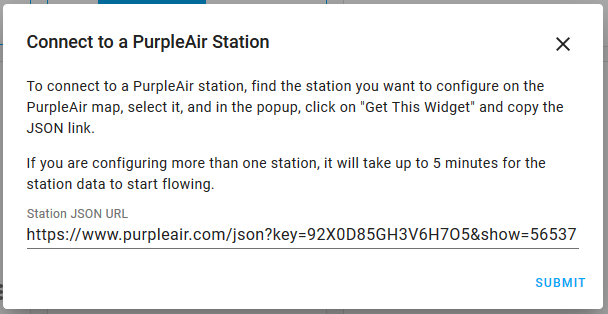
Navigate to the PurpleAir Map.
Find the nearest sensor to your location. It could be down the street or a couple counties over. It all depends on where you live!
Click on the sensor, and click on the "Get This Widget" and copy the "JSON" link (this is the annoying part).
Paste the URL in the integration dialog and submit. You should be golden!
Notes
There are a couple things to note though!
This was a one-day project, so it only supported what I needed to accomplish at the time.
It does not support accessing the local sensor data directly on your network. I don't have a device here to test with. To support batching, the API URL it uses is hard-coded.
It batches the API calls in an attempt to be nice to the free API service provided. It polls every 5 minutes and batches all configured sensors together. (PurpleAir updates their data every 2 minutes) This means that if you add a second station, it can take up to 5 minutes before the station starts showing data.
It averages out the data on stations that have two sensors. There was an attempt at determining a "confidence" score associated with it and trying to surface that somehow. I couldn't find any supporting documentation on how PurpleAir does it for their map, so it's left undone at this point. This does mean that if you have a sensor that's wildly out of whack, your AQI will reflect it accordingly. If it becomes an issue, I'll look at addressing it. You can see the confidence of the station by looking at the station card and looking for the small ✓100% label (I've only ever seen 100%).
-
There is NO ERROR HANDLING in this. Like, at all. If the network goes down or the API changes, it'll fail with error messages in your log file. If you want some insight on what it's doing, you can add the following snippet to your
configuration.yamlfile to get debug logging enabled for the component:
Fancy-factor Dashboard Cards
To up the fancy-factor in displaying the AQI data, I ended up using the mini-graph-card and a little Lovelace configuration. It's amazing how far Home Assistant has come to be able to add this level of customization while keeping it relatively easy to use and extend.
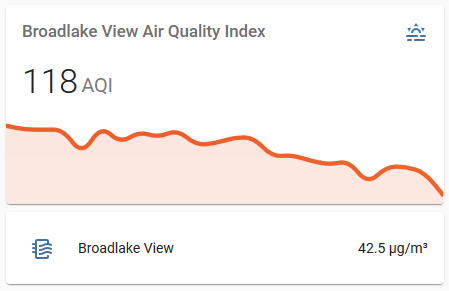
It's nothing much, it's a vertical stack with the mini graph card, and an
entity list beneath it. To increase the visual information, the graph
lines use the color threshold option to match the standard AQI color
scheme. If you want a similar setup, here's the YAML for the whole setup.
Simply copy out the mini-graph-card part if that's all you're
interested in.
type: vertical-stack
cards:
  - type: 'custom:mini-graph-card'
    entities:
      - sensor.broadlake_view_air_quality_index
    line_width: 5
    points_per_hour: 4
    hours_to_show: 6
    show:
      legend: false
      labels: false
    color_thresholds:
      - value: 0
        color: '#68e143'
      - value: 50
        color: '#ffff55'
      - value: 100
        color: '#ef8533'
      - value: 150
        color: '#ea3324'
      - value: 200
        color: '#8c1a4b'
      - value: 300
        color: '#731425'
  - type: entities
    entities:
      - entity: air_quality.broadlake_view
Please let me know if you use it or if you have any problems. You can reach me on the Home Assistant forums or open an issue in the repository.